Examining High School Completion Rates for Youth in Foster Care
Introduction
Today’s youth are tomorrow’s leaders—and there are 73 million Americans under age 18 who fit the bill (Office of Juvenile Justice and Delinquency Prevention, 2020). However, not all youth grow up in a stable environment. Some endure traumas such as abuse and neglect. Others are not adequately cared for because their families are in poor socioeconomic status—not given the correct resources to improve their children’s quality of life. When these scenarios happen, youth are placed into foster care.
407,000 youth were in the United States foster care system in 2020 (Administration for Children & Families, 2021). With a lack of intergenerational wealth, resources, and guidance once they age out of the system, youth in foster care are uniquely disadvantaged as they enter adulthood. One way to mitigate this is by opening pathways to social mobility. Increasing the amount of post-secondary opportunities available as they enter adulthood is critical.
The Importance of High School Completion
There is a strong need for a high school diploma or equivalent in the United States. The median yearly earnings for one without a high school diploma is $32,641.40—while adults who hold a highschool diploma’s median yearly earnings is $42,183.60 (Bureau of Labor Statistics, 2021). Employment opportunities are increased when one attains a high school diploma: the unemployment rate for those without a high school diploma was 8.3%, opposed to 6.2% for those who only have one (Bureau of Labor Statistics, 2021).
Having a high school diploma leads to better health outcomes. Those with a high school diploma are less likely to have a chronic illness (Vaughn, Salas-Wright, & Maynard, 2014). High school dropouts are more likely to experience poor health and premature death (Hahn et. al, 2015). If the rate of high school dropout was slashed in half, the United States would save $7.3 billion on Medicaid spending annually (DeBaun & Roc, 2013). Dropping out of high school is also correlated to higher rates of incarceration. One out of ten young, male high school dropouts are incarcerated compared to one out of thirty-five high school graduates (Sum et. al, 2009).
While obtaining a GED is considered an equivalent to a high school diploma, the positive effects of having one are less than having a diploma. GED holders earn less on average than those who hold a high school diploma—but still far greater than those without either (Census.gov, 2012). While on-time high school graduation produces the best outcomes, obtaining a GED is still a viable method to mitigate negative effects in the long-term—as many studies consider the two to be equivalent in measuring outcomes.
Unique Factors for Youth in Foster Care
Literature suggests a few reasons why youth in foster care graduate at a lower rate than their peers who are not in care. Firstly, youth in foster care experience a higher rate of school mobility—defined as the amount of school changes a youth experiences in their K-12 education. For example, youth in Colorado had 3.46 school changes on average during high school (Clemens, Lalonde, & Sheesley, 2016). Odds of graduating high school were 39% lower with one additional school change, and African American youth experienced the highest number of school changes on average (Clemens, Lalonde, & Sheesley, 2016). School changes can lead to educational interruptions due to delay periods in re-enrollment into a new school and change in requirements and prerequisites compared to previous institutions.
Similarly to school changes, suspensions were another source of disruption that were significant. Students are less likely to graduate from high school when they experience out of school suspensions compared to their peers—even if it is just once (Lenderman & Hawkins, 2021). Given that 24% of youth in foster care have been suspended at least once, it is a common school disruption for the population (Scherr, 2007).
Experiences prior to entering foster care can also play a role in whether or not a youth will graduate high school on-time or at all. Youth who have experienced confirmed cases of sexual abuse are less likely to graduate compared to their peers in foster care who have not (Okpych, Courtney, & Dennis, 2017). In order to enter foster care, youth have demonstrated less positive parental involvement and attachment. Parental involvement and attachment are important for developing childrens’ cognitive skills, as children are able to build these skills without being hindered by insecurity in their environment (West, Matthews, & Kerns, 2013). With cognitive skill development hindered, lower high school graduation rate follows. Notably, youth struggling with substance abuse or had ever received a referral to explore if they have a substance abuse disorder—something that can hinder cognitive skill development—were also less likely to graduate high school (Okpych, Courtney, & Dennis, 2017).
Current Measures
In light of the unique problems these youth face, as well as the importance of a high school diploma, there have been attempts to minimize the problems youth in foster care face in navigating high school. Amendments to the ESEA in 2015 have attempted to minimize some of the school disruptions in a child’s life by mandating that, if it is in their best interest, youth remain enrolled in the school they were attending prior to their system involvement (U.S. Department of Education and U.S. Department of Health and Human Services, 2016). Furthermore, if it is instead in the best interest of the child to transfer school districts, immediate enrollment and record transfer are required in order to reduce the harm of school change.
In a joint publication between the U.S. Department of Education and U.S. Department of Health and Human Services in June 2016, the following factors are outlined in determining educational placement:
- Preferences of the child
- Preferences of the child’s parent(s) or education decision maker(s)
- The child’s attachment to the school, including meaningful relationships with staff and peers
- Placement of the child’s sibling(s)
- Influence of the school climate on the child, including safety
- The availability and quality of the services in the school to meet the child’s educational and socioemotional needs
- History of school transfers and how they have impacted the child
- How the length of the commute would impact the child, based on the child’s developmental stage
- Whether the child is a student with a disability under the IDEA who is receiving special education and related services or a student with a disability under Section 504 who is receiving special education or related aids and services and, if so, the availability of those required services in a school other than the school of origin
- Whether the child is an EL and is receiving language services, and, if so, the availability of those required services in a school other than the school of origin, consistent with Title VI and the EEOA
Dataset
The Foster Care Independence Act of 1999 established what is now known as the Chafee Foster Care Program for Successful Transition to Adulthood (Chafee Program). The law requires the Administration for Children and Families (ACF) to develop a data collection system.
This established the National Youth in Transition Database (NYTD). It is required to gather and report data on 11 broad categories:
- budget and financial management
- housing education and home management training
- health education and risk prevention
- family support and healthy marriage education
- mentoring
- supervised independent living
- financial assistance (education, room and board)
- “Have you ever referred yourself or has someone else referred you for an alcohol or drug abuse assessment or counseling?”
- “Currently are you receiving social security payments (Supplemental Security Income (SSI), Social Security Disability Insurance (SSDI), or dependents’ payments)?”
- “Currently is there at least one adult in your life, other than your caseworker, to whom you can go for advice or emotional support?”
- “What is the highest educational degree or certification that you have received?”
Youth who turned 17 while in foster care were asked to participate in the survey, defined as the Baseline population. In the first survey, all youth in the Baseline population were surveyed. The 'cohort' is defined as all youth who participate in the Age 17 survey and is a subset of the Baseline population. After that, in some states, all youth were invited to participate in the follow-up surveys, while other states randomly selected. Follow up surveys were administered at ages 19 and 21, regardless of one's foster care status at that time.
All 3 completed cohorts will be used (2011, 2014, 2017). A cohort's year represents the year that youth in the first survey turned 17.
Data Manipulation
The datasets do not include a variable for high school graduation, instead containing a categorical variable describing a youth’s highest educational attainment at the time of survey. A dummy variable was encoded (“Graduated”) with values 0 or 1 if the youth indicated they had completed no educational milestone or if they had achieved a high school diploma / GED and beyond. The assumption was made that if a youth had achieved a degree that was beyond a high school diploma, they did indeed complete high school or equivalent. This assumption is founded in the fact that colleges, universities, and vocational certifications require high school or equivalent prior to matriculation at their institution. Some youth opted to leave this question blank (‘blank’) or declined to answer it (‘declined’), and these answers were preserved in the “Graduated” variable: meaning the variable took on four values: (0, 1, ‘blank’, ‘declined’).
Another variable, “Gradby19” was introduced to represent if a youth had reported graduating high school during the follow-up survey at Age 19. This variable was created by taking the set of youth who reported at both Age 17 and Age 19: then, for each youth, the value that “Graduated” at Age 19 took was mapped onto each instance of that youth. If the youth did not complete a survey in the Age 19 survey, then ‘None’ was filled in. In creating this variable, it is possible to see what traits the youth had at Age 17 that could contribute to their outcome at Age 19.
Note that some states performed sampling. Other states reported youth, even if they did not complete the survey at all. The datasets were filtered to include only youth that actively participated in the survey and who were eligible to take the Age 19 survey. These final datasets were used to create summary statistics. Youth who responded ‘blank’ or ‘declined’ for their graduation status at Age 19 only accounted for ~3% of all youth, so these observations were dropped when creating graduation visualizations.
Number of youth in Age 17 Survey that Participated in Age 19 Survey
| Cohort | With Blank/Declined | Excluding Blank/Declined | Percent Retained |
|---|---|---|---|
| Cohort 2011 | 7852 | 7398 | 94.22% |
| Cohort 2014 | 8906 | 8680 | 97.46% |
| Cohort 2017 | 8971 | 8787 | 97.95% |
| Combined Cohorts | 25729 | 24865 | 96.64% |
Data Limitations
There are a few major limitations with the data. Firstly, the overall response rate for the three cohorts were varied: for the first survey, the response rates were 66.5% for Cohort 2017, 69% for Cohort 2014, and 54% for Cohort 2011 from the baseline population. Furthermore, states had the option to collect the data in-person, online, or over the phone, which could be the cause of stark variations between states. For example, Arizona consistently had a response rate under 20% between the three Cohorts for the first survey, while states like Maryland had nearly perfect response rates.
Only those who responded to the first survey were invited to participate in the Age 19 and Age 21 surveys. Therefore, low response rates for the first wave translate to even lower response rates in the second wave. Overall, Cohorts 2017, 2014, and 2011 had response rates 36%, 37%, and 26% respectively from the baseline population during the Age 19 survey.
Since participation in the survey is entirely voluntary, this sample of youth may not entirely reflect the Baseline population.
Data Visualizations
Who is in the Dataset?
Note: Summary statistics are not easily available for youth in foster care that are Age 17 and have had their 17th birthday in foster care. In lieu of that, I will be comparing the cohort to the demographic breakdown of foster care as a whole. It is an estimate, not an assurance, of the cohort's representativeness. Data for cohort comparison derived from Foster Care Statistics 2019.
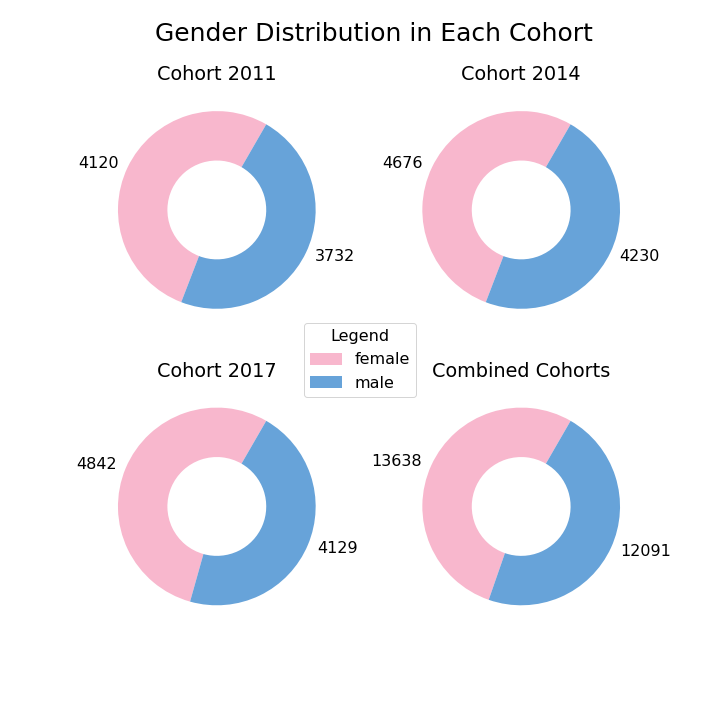
Girls could be overrepresented in the cohort. Not only are the cohorts more than 50% female, but the foster care population is more than 50% male.
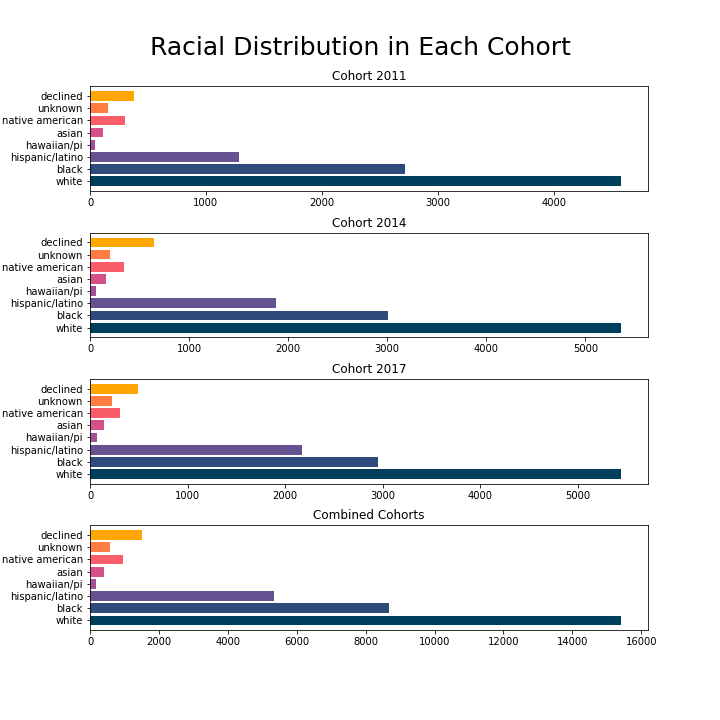
White, Black, Native American, Asian, Hawaiian/Pacific Islander, and Hispanic (of any race) youth could be accurately represented in the cohort. However, the non-insigficant sum of youth either declined to answer, or stated that they did not know their race. If the youth who declined to answer are disporoportionately one race, then the cohort could be not representative of the Baseline population.
This map is interactive. Hover over the state to view the participation percentage.
There is stark variation in state representation relative to the Baseline population, even when accounting for sampling done by some states. Since states have the discretion to administer the survey in an avenue they choose, it is not surprising that some have high participation (~70%) while others have low participation (~20%). The lowest state, Arizona, has ~4% participation.
Who Graduates?
All 50 states, District of Columbia, and Overall rate displayed by default. Scroll through the legend page to see what color the state you're looking for is, or hover over a particular line to see what state it is. You can toggle to display only a particular state with the drop-down menu. If you wish to return to the original display with all rates, refresh the page.
There were some states that I suspect to have errornous data in Cohort 2014: South Dakota, Colorado, Illinois, and West Virginia. The categorical representation for 'blank' response was '77.0', but these states contain '78.0' in the value for highest education attained and therefore were not converted to a category when loaded into a dataframe. They were considered to be 'none of the above'. Illinois had the lowest errornous entries, with only 4. West Virginia had the most with 139. In Cohort 2011, these states also had 'blank' entries disporoportionately to other states.
There were no abnormalities with Cohort 2017.
This map is interactive. Hover over the state to view the graduation percentage. States South Dakota, Colorado, Illinois, and West Virginia potentially affected by errornous data entry.
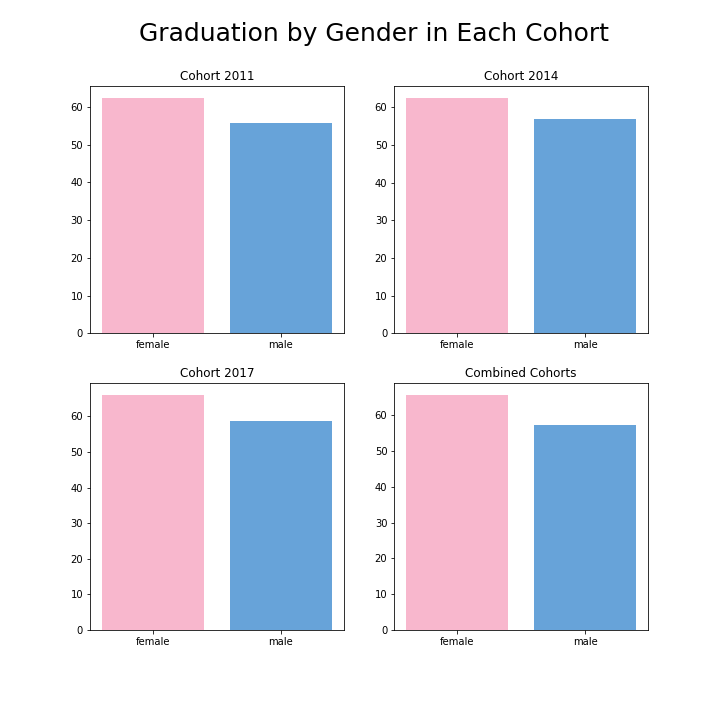
In all cohorts, females graduate at higher rates than males.
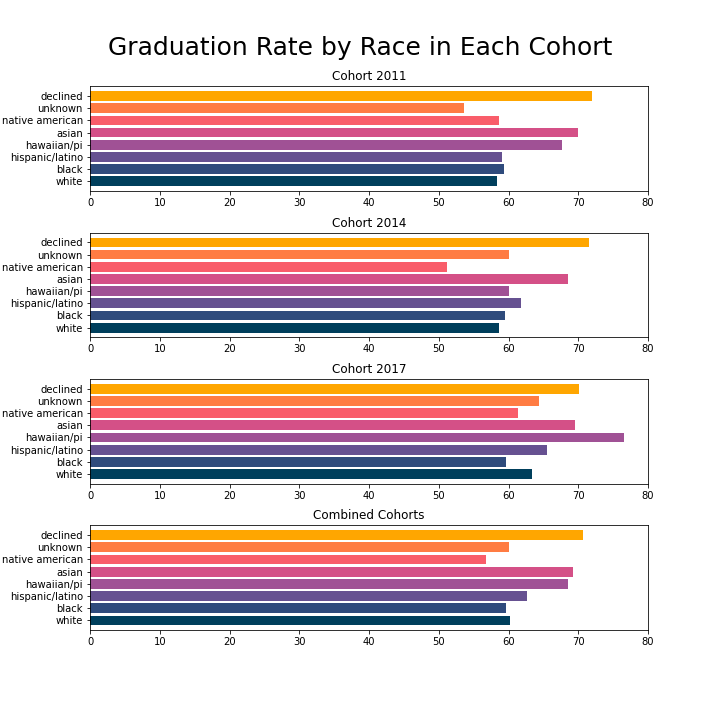
Interestingly, there is some variation observed between cohorts. In 3 out of the 4 charts, those who declined to state their race graduated at the highest rates compared to others.
Next Steps
Understanding the demographic of the population is a key first step in analyzing factors for high school completion.In addition to variables used to create charts, the data contains a rich set of information including (but not limited to): public assistance utilization, foster care status, incarceration history, and homelessness history.
I have already made summary statistics for the three cohorts to identify factors highly correlated with graduation. Then, to investigate the statistical significance, I plan on building and testing Logistic Regression models.
I plan on building multiple classification machine learning models to predict if a youth will graduate high school by Age 19. Noting that there are ethical concerns with using machine learning in child welfare, I argue that this is the best-suited context to use it in: youth are fully, voluntarily answering questions. The model would allow agencies to give more resources to those who are at risk of not graduating high school without taking away resources from those who "do not need it." As more cohorts complete and release, the model's accuracy can be improved.